Data Visualization John Leung 2016
1 / 31
Topics
- Overview
- Types of Graphical Visualizations
- Tools
- Inspirations
2 / 31
Data Visualization
- Visual Communication
- Visual Representation and Abstraction of Data
- Techniques used to communicate data or information by encoding it as visual objects (e.g., points, lines or bars) contained in graphics
- Is both an art and a science
3 / 31
Goals
- To communicate information clearly and efficiently through graphical means
- To help users analyze and reason about data and evidence
- To make complex data more accessible, understandable and usable, such as making comparisons or understanding causality
- To create a better understanding of the data
- To help uncover trends, realize insights, explore sources, and tell stories Eg. Minimum Wage
- To stimulate viewer engagement and attention Eg. - Climate Change
4 / 31
Graphical Displays Should
- Show the data
- Induce the viewer to think about the substance
- Avoid distorting what the data has to say
- Present many numbers in a small space
- Make large data sets coherent
- Encourage the eye to compare different pieces of data
- Reveal the data at several levels of detail, from a broad overview to the fine structure
- Serve a reasonably clear purpose: description, exploration, tabulation or decoration
- Be closely integrated with the statistical and verbal descriptions of a data set
5 / 31
Types of Graphical Visualizations
6 / 31
Time-series
- A single variable is captured over a period of time, such as the unemployment rate over a 10-year period
- Useful for demonstrating trends and periodicity
7 / 31
Line Charts Eg: Stock charts
Area Charts / Layered Area Eg.
Percent Area Charts Eg.
Curve Fitting Charts Explaination
Spline Charts Eg.
OHLC, Candlestick Charts Eg.
Real World Example
8 / 31
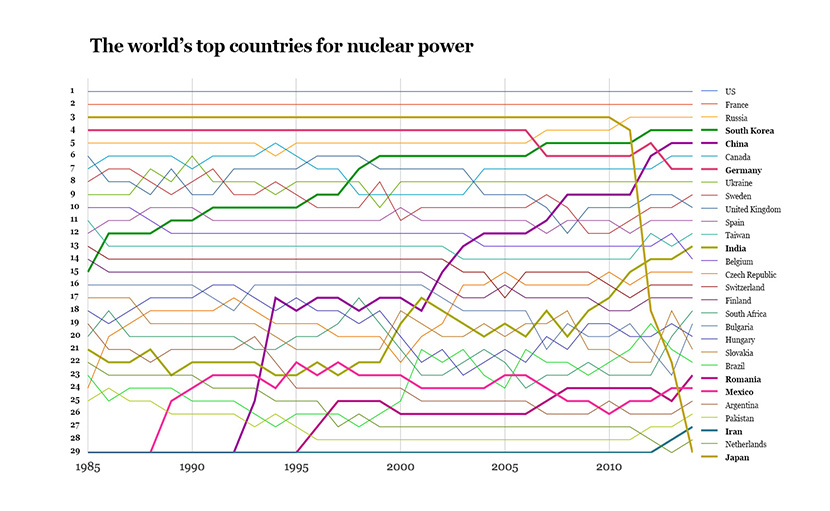
Rank Charts / Bump Chart

9 / 31
Gap charts
- Builds on the rank chart by allowing extra space between curves to represent value difference behind the ranking
Eg. - visurugby
Impact Charts
10 / 31
Part-to-whole
- Categorical subdivisions are measured as a ratio to the whole
- Pie charts and bar charts show the comparison of ratios well
13 / 31
Deviation
- Categorical subdivisions are compared against a reference, such as a comparison of actual vs. budget expenses
- Bar charts can show comparison of the actual versus the reference amount Eg. - Deviation Bar Graph
14 / 31
Frequency distribution
- Shows the number of observations of a particular variable for given interval, such as the number of years in which the stock market return is between intervals such as 0-10%, 11-20%, etc.
Histogram
- A type of bar chart, may be used for this type of analysis Eg. 3D histogram
Circular Histogram / SolarPlot Eg.
15 / 31
Box plot
- Helps visualize key statistics about the distribution, such as median, quartiles, outliers, etc.
- Similar to candlestick charts
Eg.
16 / 31
Correlation
- Comparison between observations represented by two or more variables to determine if they tend to move in the same or opposite directions
- Eg. Plotting unemployment (X) and inflation (Y) for duration
- To emphasize outliers
Scatter plot Eg.
Heat Map Eg.
Color Coded Tables/Tier List Eg.
Radar Chart Eg.
17 / 31
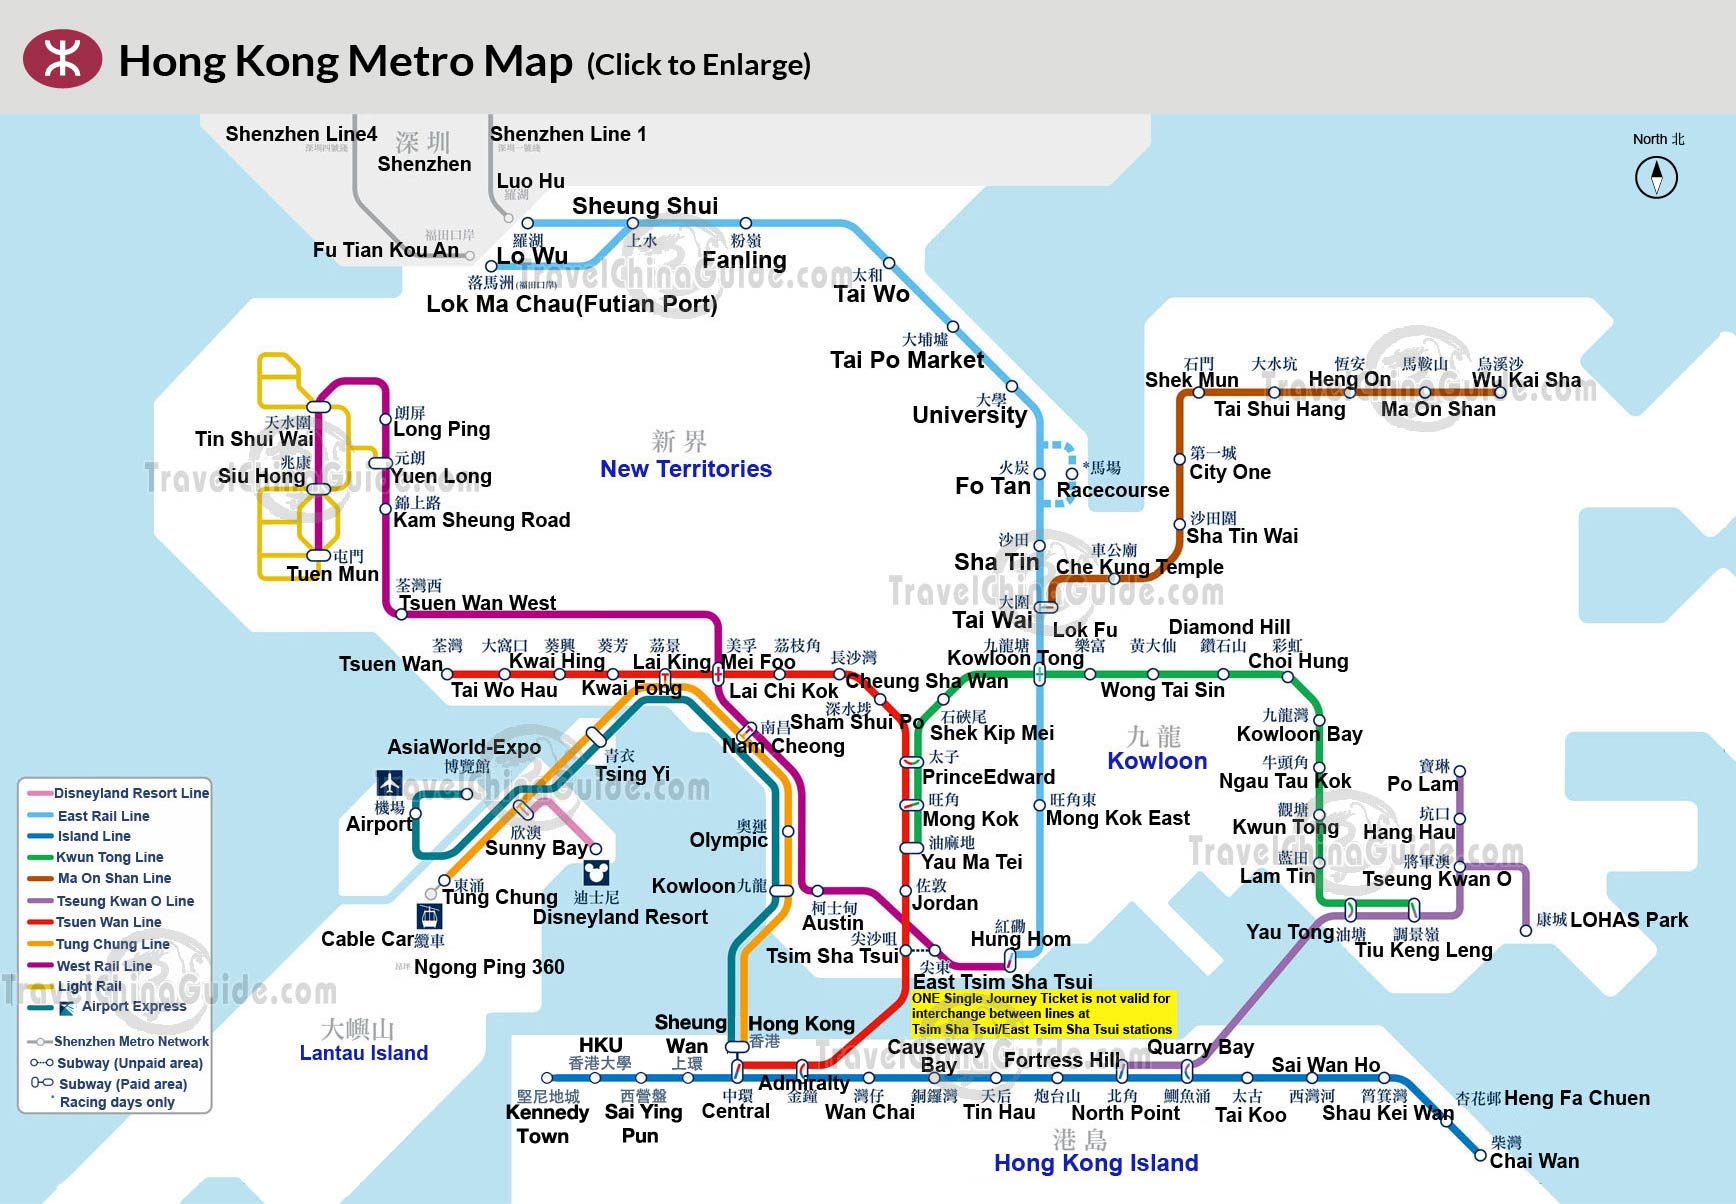
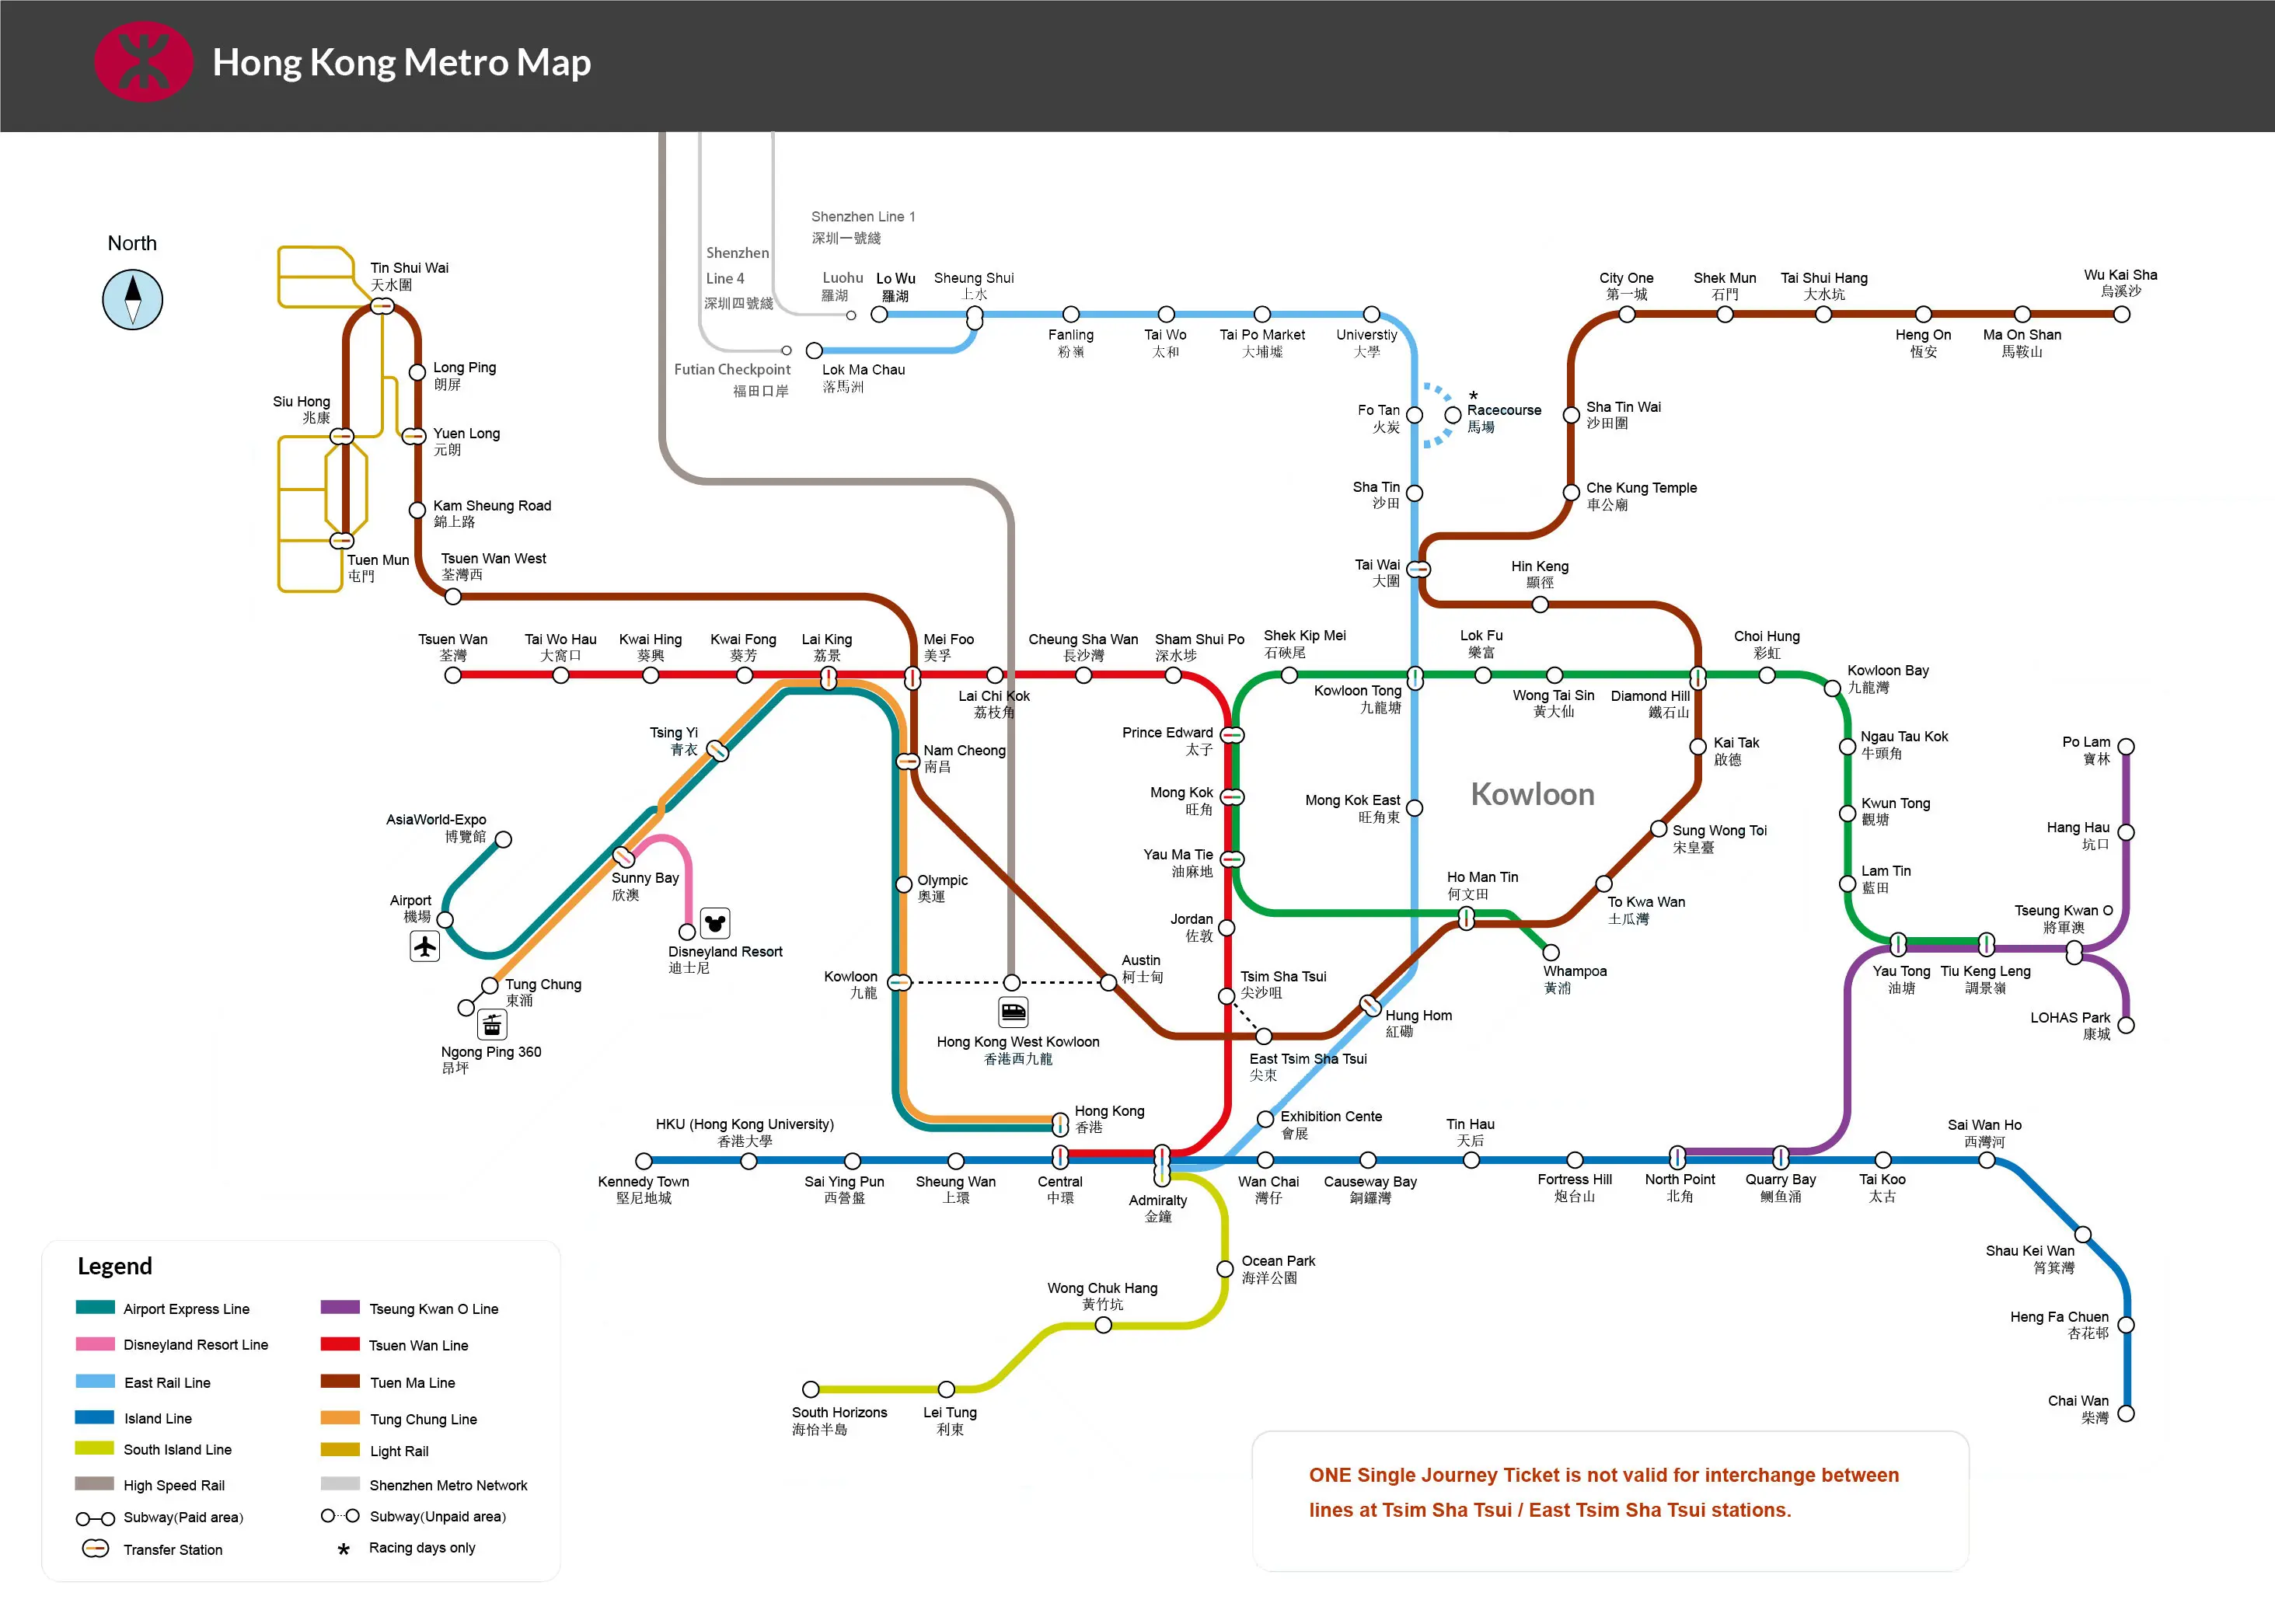
Geographic or geospatial
- Comparison of a variable across a map or layout, such as the unemployment rate by state or the number of persons on the various floors of a building
Map Overlays Eg. Social Explorer
18 / 31
Cartogram
19 / 31
Distance Cartogram
20 / 31
Tools (Javascript)
- Assemblers
- Single Purpose Libraries
- High level Libraries
- Platforms and Playgrounds
- Lists
23 / 31
High level Libraries
Non d3 dependent:
Non open source
27 / 31
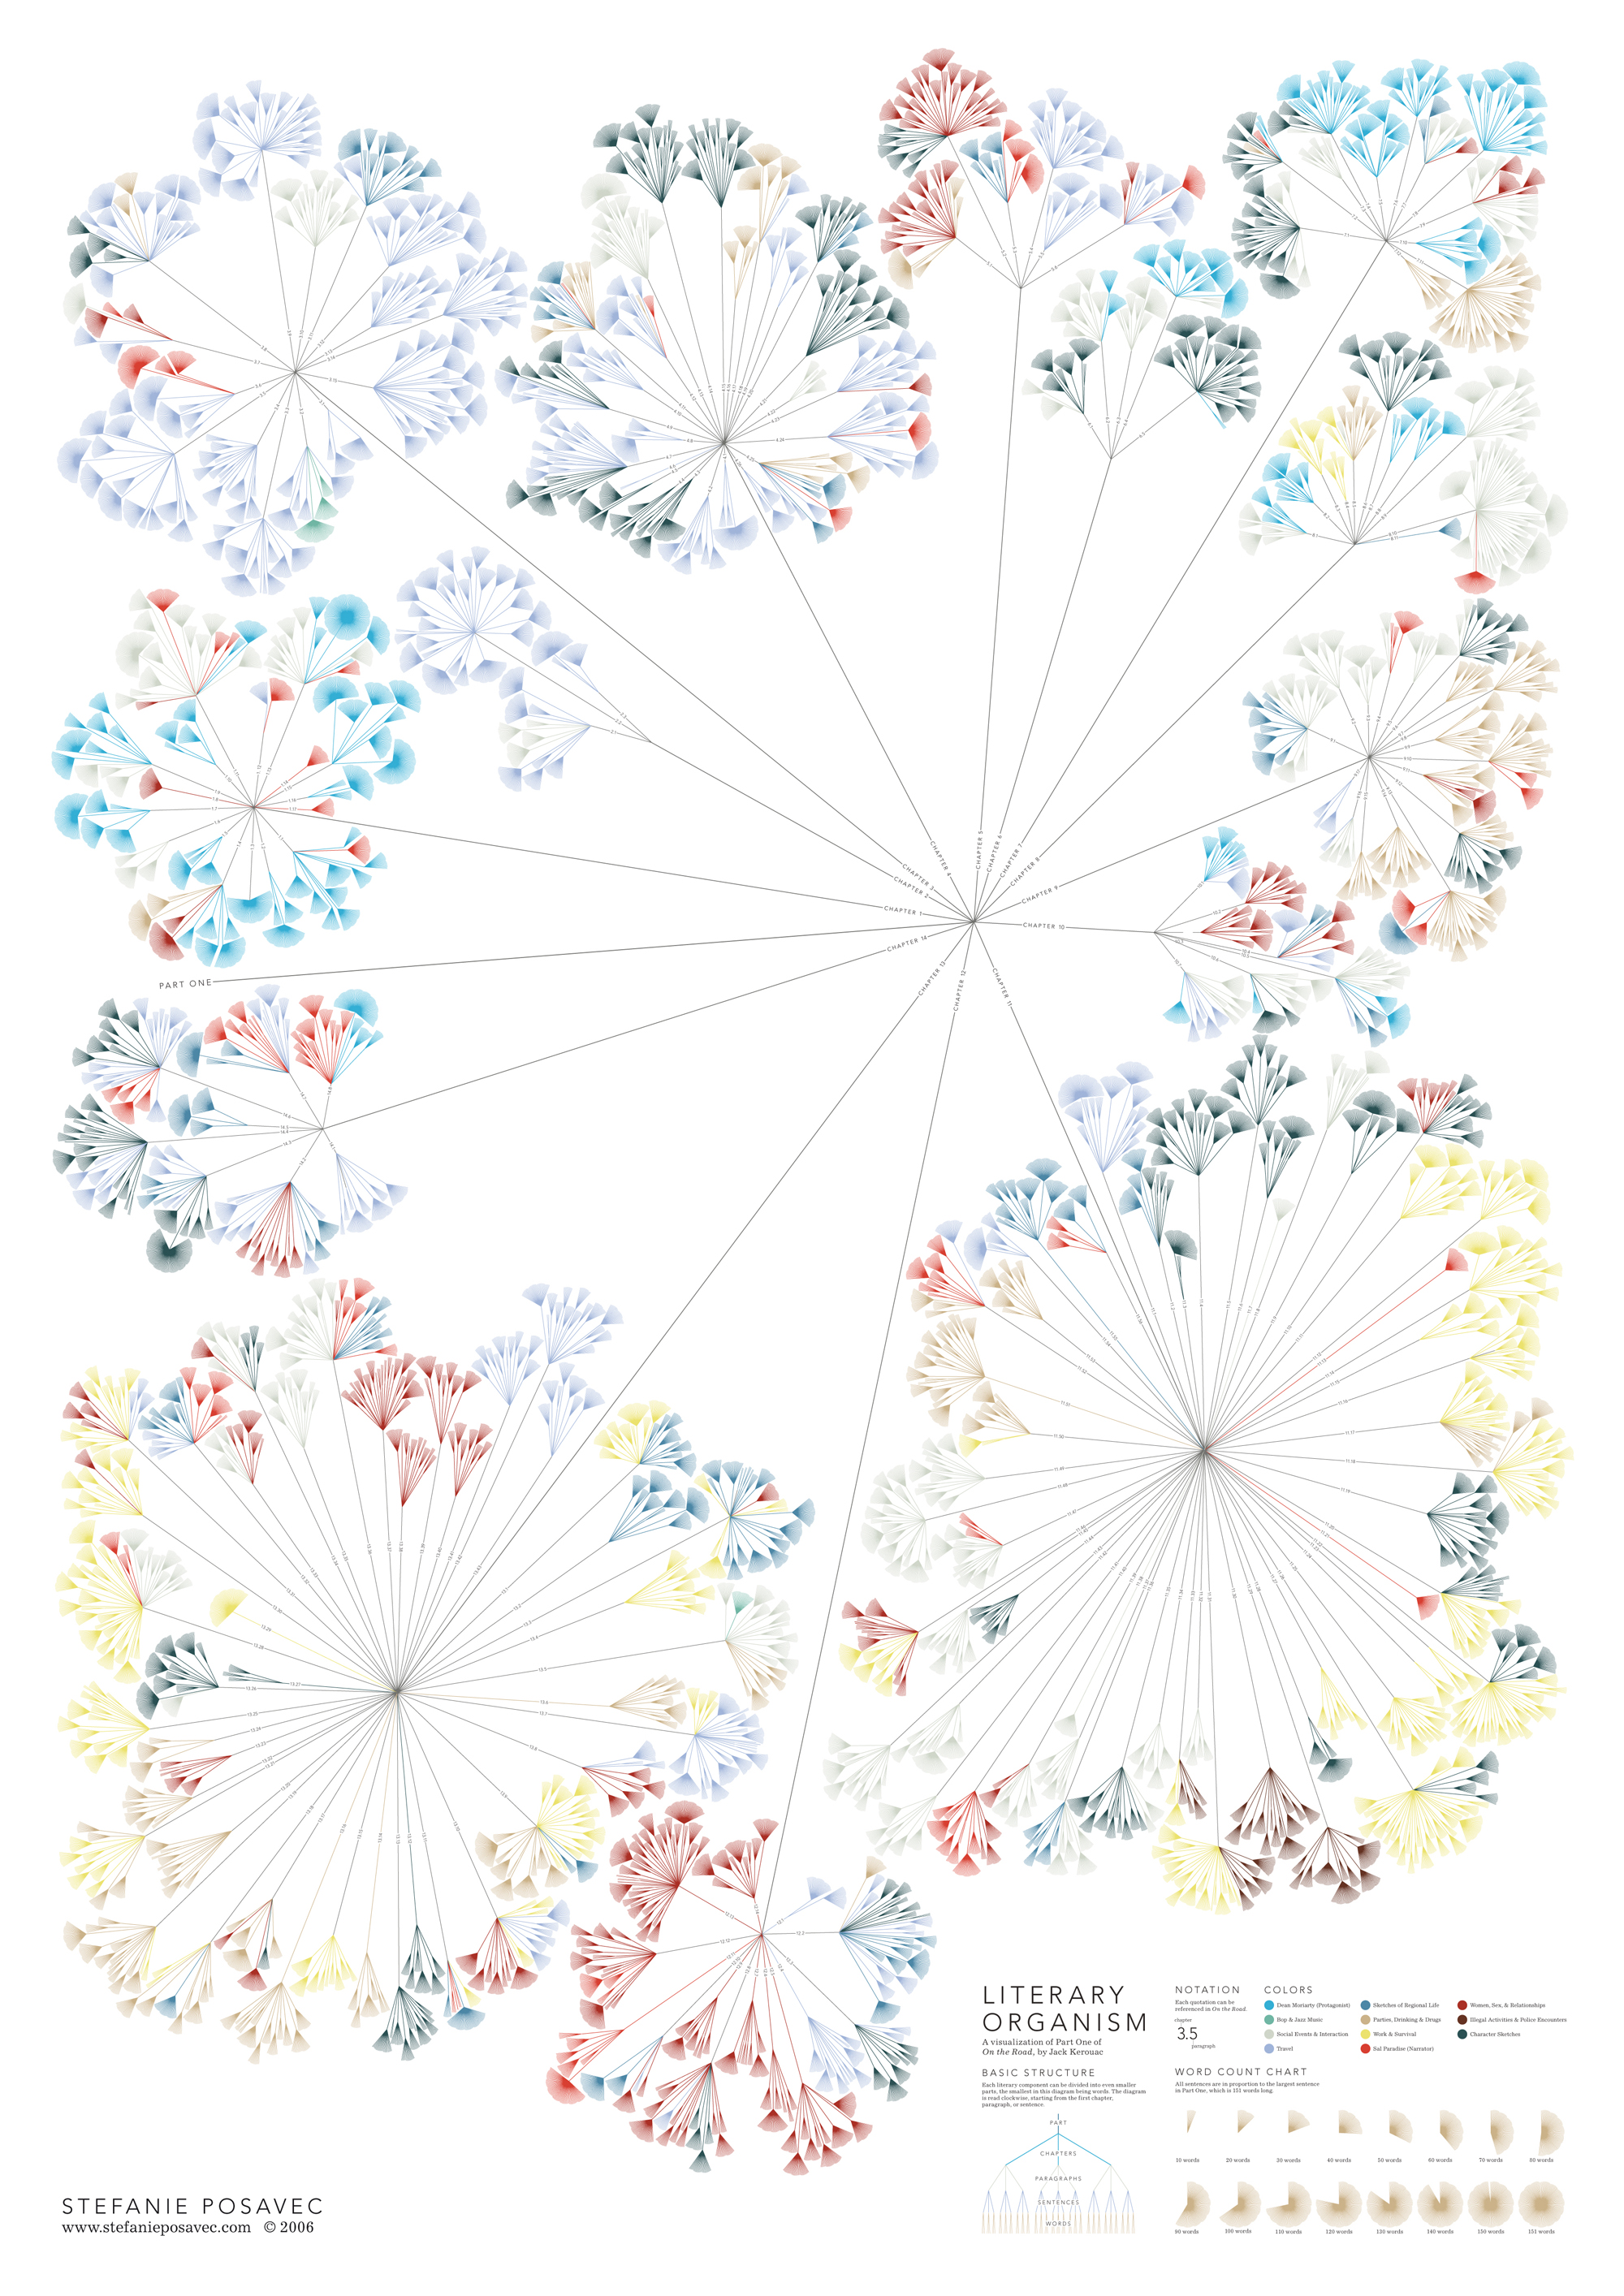
Inspirations / Eye Candies
- d3 Gallery
- TimeViz Browser
- information aesthetics
- Data Pointed
- Information Geographies
- Flowing Data
- Foreign Born Population
30 / 31